
Home | About Us | How to Participate | Biodiversity Modules | Projects | Maps | News | Resources
NatureMapping Activities
13. Using Emerging Technologies to collect and analyze data
Purpose:
To show how to
- migrate from data collection forms and maps to NatureTracker data
collection software and GPS units
- learn the concept of Geographic Information Systems (GIS) through an
exercise using Powerpoint and Excel
- understand the basics of GIS with a real example of how GIS can be used to answer a question about the influence spartina has on oyster beds
Materials:
- Steps to collect geographic data
- Global Positioning System (pdf)
- Aerial and Topo maps
- Powerpoint GIS
- Students questions and answers (pdf)
- Pros and Cons of using Emerging Technologies (pdf)
Teacher’s Guide:
Pros and cons of using the below-mentioned technological tools. (view pdf)
Geographic Location
- Review the steps to collect geographic data.
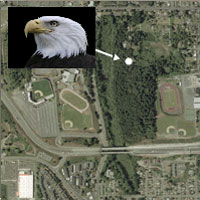
- Once you have your geographic locations, you are ready to import your data into GIS and lay it over some type of map for example an aerial or topo map
- You can also link a picture to the location (See bald eagle photo over map)
GPS
- The GPS unit is a useful tool but you must know the settings to provide accurate lat/long (view pdf)
NatureTracker
- NatureTracker is data collection software loaded onto a handheld device with a built-in GPS unit.
- This device allows you to collect data in the field (although you should complete the data collection form as backup) and download the data into the spreadsheet format.
- This process is faster, more accurate.
- A photograph and topo or aerial photo can be imported into the software on the PC...one-step process compared to using a data collection form and GPS unit.
- NatureTracker data can be exported out of and imported into GIS. Once in GIS, various analyses can be conducted.
- For a better understanding of NatureTracker view the following demo.
GIS/ArcView (Math and Geography) Overview [Read this article]
- Spreadsheets = Tables
- Individual observations are entered on each line of the table.
- Items, such as Species ID codes are linked to GIS “layers” so a question can be asked or "queried" with the appropriate points/polygons highlighted.
There are 3 types of GIS layers:
- Points (Bird sightings, clam locations, etc.)
- Lines (Roads, rivers, driving routes)
- Polygons (Outline of a defined area such as farm fields, habitats, tidal flat, etc.)
Examples of layers (also called coverages):
- Digital ortho-photos (aerial photos) – (geo-referenced pictures that line up with the rest of the layers)
- Ecoregions – defined based on geology (polygons)
- County (polygons)
- Major highways (lines)
- Wildlife range maps (polygons)
- NatureMapping observations (points)
One step to understand how GIS works is to make a Powerpoint GIS. This process may be preferred over the actual GIS software if the area you are working in is small.
The following tutorial walks you through building a Powerpoint GIS and creating a spreadsheet
that corresponds with the monitoring sites in the tutorial.
(Powerpoint GIS)

Community Explorer is a true-life example of how GIS can help answer questions the effects of introduced bullfrogs, green crabs, and spartina (an aquatic weed). The student activity is for upper middle and high school students. Questions in the activity are answered within Community Explorer (pdf with questions and answers).
Definitions
GIS - Geographic Information Systems